

By the numbers
Take a look at some of the financial information, facts and figures that sum up 2013 for VCU Medical Center.
S&P rating:
Outlook: Stable
Moody’s rating:
Outlook: Stable
VCU Health System financial statement*
(in thousands for fiscal years ending June 30)
Total operating revenue
$2,058,392
Nonoperating revenues and expenses
$32,780
Salaries, wages and benefits
$794,108
Supplies, purchased services and other expenses
$444,358
Depreciation and amortization
$62,060
Medical claims expense
$569,098
* includes VCU Health System components: MCV Hospitals, MCV Physicians, Virginia Premier Health Plan, Children’s Hospital of Richmond at VCU, University Health Services and UHS Professional Education Programs
Total operating revenue
(in thousands for fiscal years ending June 30)
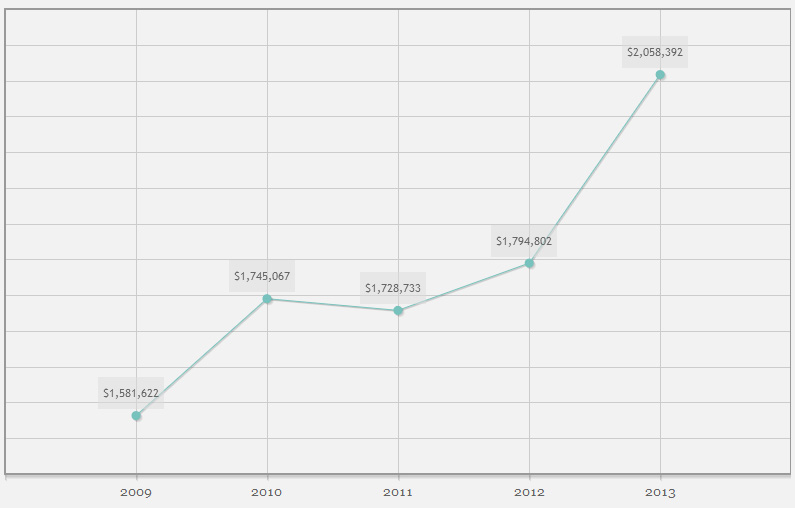
- 2009
- 2010
- 2011
- 2012
- 2013
1,581,622
1,745,067
1,728,733
1,794,802
2,058,392
Virginia Premier Health Plan member months
- 2009
- 2010
- 2011
- 2012
- 2013
1,610,815
1,748,124
1,811,898
1,766,702
2,050,883
Sponsored research awards
- 2009
- 2010
- 2011
- 2012
- 2013
$134.4 million
$150.9 million
$147 million
$132 million
$141 million
Student enrollment*
- School of Allied
Health Professions - School of Dentistry
- School of Medicine
- School of Nursing
- School of Pharmacy
School of Allied Health Professions
2009
1,096
1,096
2010
1,100
1,100
2011
1,060
1,060
2012
1,044
1,044
2013
1,023
1,023
School of Dentistry
2009
489
489
2010
509
509
2011
516
516
2012
505
505
2013
490
490
School of Medicine
2009
1,318
1,318
2010
1,290
1,290
2011
1,276
1,276
2012
1,294
1,294
2013
1,292
1,292
School of Nursing
2009
968
968
2010
975
975
2011
954
954
2012
866
866
2013
909
909
School of Pharmacy
2009
603
603
2010
609
609
2011
608
608
2012
611
611
2013
605
605
* includes on-campus and off-campus enrollments